


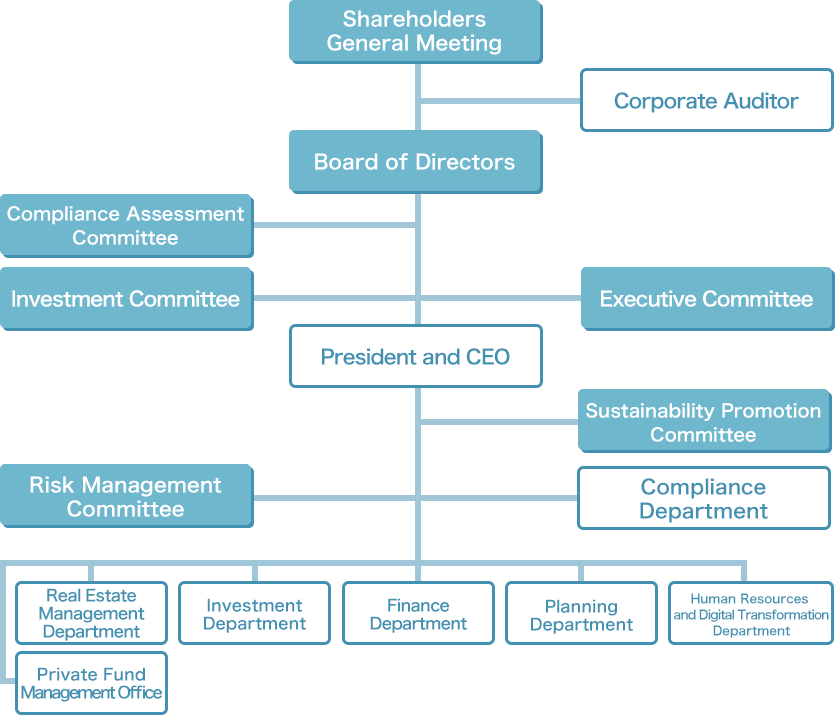
Organization Chart
| As of Aug. 31, 2023 |
As of Aug. 31, 2024 |
As of Aug. 31, 2025 |
|
| ■Full-time personnel: | 47 | 48 | 51 |
| ■Percentage of male employees | 44.7% | 39.6% | 43.1% |
| ■Percentage of female employees | 55.3% | 60.4% | 56.9% |
| ■Average number of years of employment | 8years 3months | 8years 3months | 8years 7months |
| ■Number of credentialed personnel | |||
| Real Estate brokers | 23 | 21 | 24 |
| ARES Certified Masters | 22 | 23 | 20 |
| Certified Building Administrators | 5 | 3 | 3 |
| First-class registered architect | 3 | 2 | 2 |
| Real estate appraisers | 3 | 3 | 2 |
| Attorney | 1 | 1 | 3 |
| MBA | 2 | 2 | 2 |
| CMA | 3 | 2 | 2 |
| Licensed Representative of Condominium Management Company | 1 | 1 | 1 |